The lowest freight quote is often not the lowest FBA landed cost. If I’m shipping from China to the U.S., I need to compare cost per sellable unit, not just cost per container or cost per CBM.
Here’s the short version:
- FCL often works better when my shipment is large enough to spread flat container costs across more units.
- LCL often works better for smaller orders, launches, and test shipments, but it can bring extra CFS, deconsolidation, and handling fees.
- A rough checkpoint is 15 CBM, but my actual break-even point depends on my quote, carton size, unit count, duties, prep fees, and delivery costs.
- Transit time on a quote is not the same as Amazon-ready time. LCL often adds more handling steps and can add delay risk.
- If inventory arrives late, my true cost can go up through stockouts, damage, and fewer sellable units.
What I need to compare:
- product and origin charges
- ocean freight
- U.S. import fees
- port and inland delivery costs
- FBA prep costs
- timing, handling, and damage risk
FCL vs LCL: Which One Gets You Restocked Faster | AMZ Prep
sbb-itb-f9a91f9
Quick Comparison
| Criteria | FCL | LCL |
|---|---|---|
| Pricing basis | Per container | Per CBM or weight |
| Best for | Larger replenishment orders via Amazon FBA shipping | Smaller shipments and test orders |
| Upfront freight cost | Higher | Lower |
| Per-unit cost at higher volume | Often lower | Often higher |
| Handling steps | Fewer | More |
| Damage and delay risk | Lower | Higher |
| Transit range | Often 20–35 days | Often 25–40 days |
| Cost pattern | More fixed | More fee-heavy |
Simple rule: I should choose the option with the lower all-in landed cost per sellable unit, as long as it also fits my restock date and risk level.
The rest of the article breaks down how to run that math in a clean, side-by-side way.
Build a full landed cost comparison before choosing a shipping method
Don’t choose between FCL and LCL based on ocean freight alone. Compare both options using total landed cost per sellable unit from the factory door to the Amazon fulfillment center.
The simplest way to do that is to use one worksheet for both quotes. That way, you’re comparing the same charges side by side, and the only thing that changes is how each fee scales.
| Line Item | Billing Basis | Applies To |
|---|---|---|
| Base ocean freight | Per container (FCL) / Per cubic meter (CBM) (LCL) | Both |
| Fuel surcharge (BAF) | % of freight or per container/CBM | Both |
| Peak season surcharge | Per container (FCL) / Per CBM (LCL) | Both |
| Origin terminal handling (OTHC) | Per container (FCL) / Per CBM (LCL) | Both |
| Import paperwork and brokerage | Per shipment | Both |
| Consolidation fee | Per CBM | LCL only |
| CFS handling and deconsolidation fee | Per CBM or per shipment | LCL only |
| Customs duties and taxes | % of cargo value | Both |
| Destination terminal fees | Per container or per shipment | Both |
| Inland drayage / trucking | Per container (FCL) / per delivery (LCL) | Both |
| Cargo insurance | % of cargo value | Both |
| FNSKU labeling | Per unit | Both |
| Palletization | Per pallet | Both |
Separate fixed charges from variable charges
After you list every cost, split them into two groups.
Some fees stay fixed per shipment or per delivery, like import paperwork, brokerage, and inland delivery. Others change with shipment size or cargo value. Ocean freight and terminal handling work this way: for FCL, they’re charged at the container level; for LCL, they’re tied to volume. Duties, insurance, and FBA prep also move with cargo value or unit count.
This matters because FCL and LCL spread those costs in different ways. With FCL, the container rate and terminal handling sit at the container level, so adding more units can bring the cost per unit down. With LCL, freight is billed by volume or weight, and destination handling fees get spread across fewer sellable units. That can make the cost per unit climb faster than expected.
Why a lower LCL rate per CBM can still cost more per unit
LCL is billed by volume or weight, whichever is higher. So a low rate per CBM doesn’t tell the whole story. The bigger issue is the extra handling built into LCL shipments.
CFS handling and deconsolidation fees often run $40–$80 per CBM combined at origin and destination, or $150–$300 total. On a small shipment, those charges can eat up any savings from a lower ocean rate.
Ask for one itemized quote for both modes, then compare:
- landed cost per unit
- break-even volume
That’s the number that shows which option gives you the lower landed cost per unit. And once you have that, the break-even point becomes much easier to spot.
How FCL and LCL differ in cost structure and break-even volume
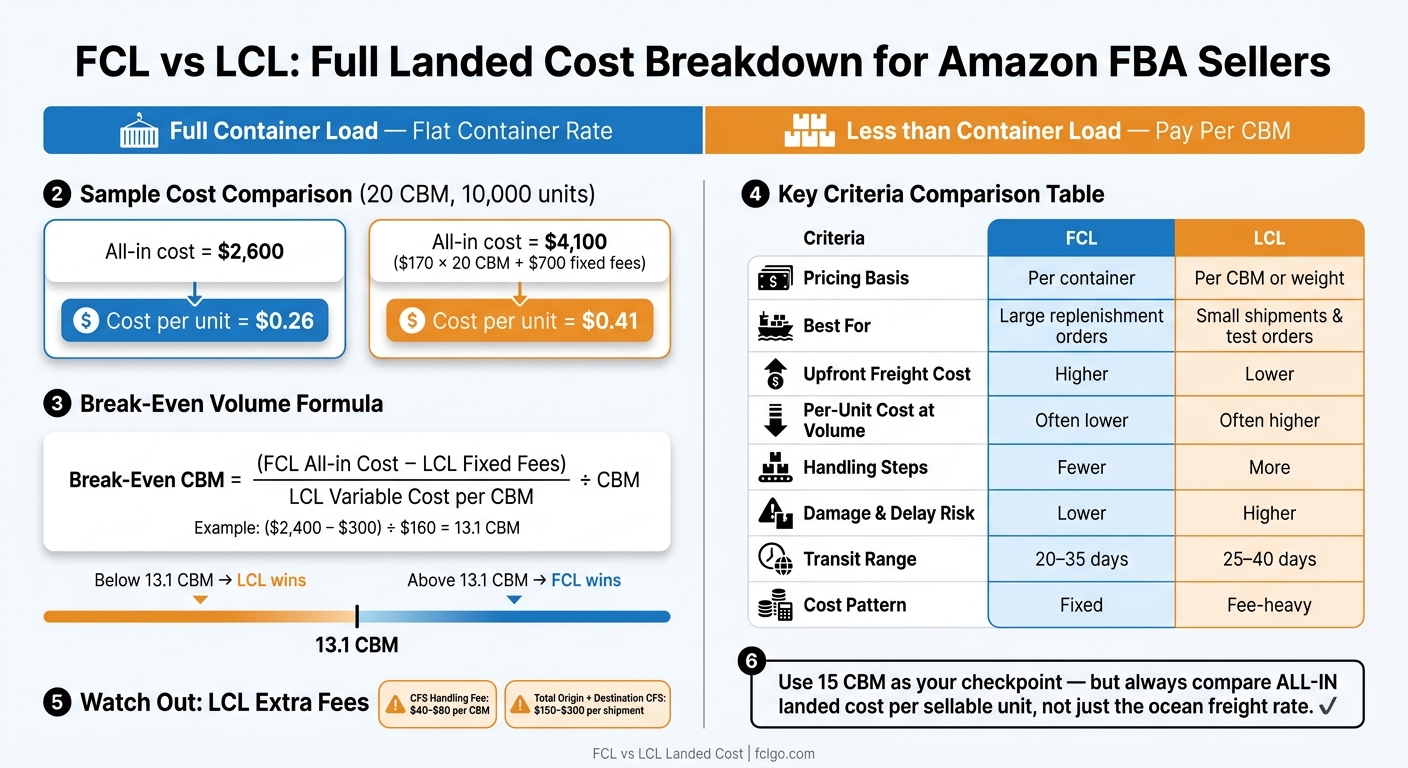
FCL vs LCL Shipping: Full Landed Cost Comparison for Amazon FBA
Using the landed-cost worksheet above, the next step is to find the shipment size where FCL’s flat container price starts to beat LCL’s pay-for-what-you-use model.
Here’s the core idea: FCL is a flat container charge. As you load more sellable units into that container, the freight cost per unit goes down. LCL works differently. It’s billed on whichever is higher: volume or weight. So if you ship 4 CBM that weighs 6 metric tons, the charge may be based on weight, not volume. LCL freight also passes through origin and destination container freight stations, which adds steps that FCL skips.
When FCL lowers per-unit cost
Take a simple example. Say an all-in 20-foot FCL shipment costs $2,400 and holds 8,000 units across 16 CBM. That puts freight at $0.30 per unit.
Now compare that with LCL. If the same shipment moves at an all-in rate of $180 per CBM, the total comes to $2,880, or $0.36 per unit. That’s the freight part of landed cost for each sellable unit.
FCL can also work well for repeat replenishment orders. If you can line up shipments with container departures, you cut out repeated CFS handling and usually get steadier costs from one order to the next.
When LCL makes sense despite added fees
LCL still has a clear place. If your cargo doesn’t come close to filling a container, paying only for the space you use can make more business sense, even when the per-unit freight cost is higher.
That often applies to:
- a product launch
- a market test
- a small replenishment order meant to avoid a stockout
For example, if a launch order uses 5 CBM and includes 2,000 units, LCL may still be the better move. Why? Because it lets you avoid buying and storing thousands of extra units just to fill a container. Those added handling steps matter too, since they can affect timing and damage risk.
Comparison table and a break-even volume method
The break-even formula is:
Break-even CBM = (FCL all-in cost − LCL fixed fees) ÷ LCL variable cost per CBM
Using the sample numbers:
($2,400 − $300 fixed LCL fees) ÷ $160 per CBM = 13.1 CBM
So, below 13.1 CBM, LCL is usually cheaper. Above that, FCL often starts to win.
If you want to turn that into a per-unit check, use your own carton size and unit count:
- FCL cost per unit = All-in FCL cost ÷ total sellable units
- LCL cost per unit = (LCL rate × CBM + fixed LCL fees) ÷ total sellable units
Here’s a concrete example using 500 cartons at 0.04 CBM each, with 20 units per carton. That’s 10,000 units total and 20 CBM.
| FCL | LCL | |
|---|---|---|
| All-in cost | $2,600 | ($170 × 20 CBM) + $700 fixed = $4,100 |
| Cost per unit | $0.26 | $0.41 |
Use your own quote for the final call. Destination charges and handling fees often shift the break-even point.
And once freight cost gets close, the choice usually comes down to the other moving parts: handling, port fees, transit time, and inventory risk.
How handling, port fees, transit time, and inventory risk affect landed cost
Once freight rates get close, handling and timing start to drive the real landed cost. The quote in front of you is only part of the picture. Add handling, port fees, delays, and stockout risk, and the gap between FCL and LCL can get a lot bigger than the ocean rate suggests.
How LCL handling and CFS fees add cost and risk
LCL cargo moves through origin and destination CFS facilities. That means more handling fees, more rehandling, and more sorting. Every extra touch adds a chance for damage or delay, which is a bigger issue for fragile cartons or tightly packed goods. And if one shipper on the container has a paperwork problem, the whole container can get held up.
That’s why these charges shouldn’t be treated as random add-ons. They belong in your landed cost math.
The next move is to line those charges up against the full shipment timeline.
Why published transit time is not the same as Amazon-ready time
Published transit time leaves out a lot: pickup, export handling, customs, drayage, and Amazon appointment timing. For Amazon sellers, actual door-to-Amazon shipping time starts when the supplier releases the goods and ends when Amazon has the inventory in hand.
Put simply, published transit time makes the delivery window look shorter than it is.
| Stage | Responsible Party | Cost Category | Unique to LCL? |
|---|---|---|---|
| Supplier Pickup | Freight Forwarder | Inland Freight | No |
| Export Prep & Customs | Forwarder / Broker | Documentation / Export Fees | No |
| Consolidation (CFS) | Forwarder / CFS | CFS Stuffing / Handling Fee | Yes |
| Ocean Transit | Ocean Carrier | Ocean Freight | No |
| U.S. Discharge | Port Terminal | Terminal Handling (THC) | No |
| Customs Clearance | Customs Broker | Duties / MPF / HMF / ISF | No |
| Deconsolidation (CFS) | Forwarder / CFS | CFS Stripping / Handling Fee | Yes |
| Drayage / Trucking | Trucking Company | Inland Freight | No |
| FBA Prep / Palletizing | Prep Center / Warehouse | Labeling / Pallet Fees | Optional |
| Amazon Appointment | Carrier / Amazon | Waiting / Accessorials | No |
| Amazon Receiving | Amazon | FBA Fees | No |
LCL usually takes 25–40 days, while FCL usually lands in the 20–35 day range, mostly because LCL cargo spends extra time at origin and destination CFS points. So don’t plan from ship date forward. Plan backward from the date you need inventory in the U.S.
FCL vs. LCL: damage exposure and cost predictability
After rate and timing, the next big issue is control. With FCL, your cargo stays in one sealed container from the factory to the destination or prep center. That cuts down handling risk and gives you more say over the shipment environment. For fragile or high-value products, that can matter a lot.
| Criteria | FCL | LCL |
|---|---|---|
| Shared container handling | No – single shipper | Yes – multiple shippers |
| Port and CFS charges | Fixed THC at port | Variable CFS fees per CBM |
| Damage risk | Low – minimal touchpoints | Higher – frequent extra rehandling |
| Cost stability | High – fixed container rate | Moderate – varies by CBM / weight |
| Customs delay risk | Independent | Shared – one hold can delay all cargo |
| Best Fit | Larger or fragile shipments | Small trial shipments |
If your inventory buffer is thin, delay risk can end up costing more than the freight savings.
How to choose between FCL and LCL for your Amazon shipment
A step-by-step decision process for Amazon sellers
Once you know your break-even point, the next step is simple: check the shipment in front of you against a short decision process. Start with volume, then work through cost and timing.
- Measure your shipment: Calculate total CBM, carton count, unit count, and gross weight. Those numbers shape both your shipping mode and your rate. They also help you gauge handling risk.
- Get itemized quotes for both options: Ask for line-item quotes for FCL and LCL on the same route. Don’t compare headline rates alone. Compare the full breakdown.
-
Add every downstream cost: Include duties, drayage, FBA prep, and warehousing. Then divide total landed cost by sellable units to get your per-unit cost.
Cost by itself doesn’t tell the whole story. Timing also affects how much inventory risk you carry. - Check your timing: Use door-to-Amazon timing, not the ship date, because LCL often adds CFS time. Work backward from the date Amazon needs the inventory, not the date the goods leave port.
Use 15 CBM as a rough checkpoint, not a hard rule.
Conditions that favor LCL and conditions that favor FCL
| Condition | Favors LCL | Favors FCL |
|---|---|---|
| Shipment volume | Under 15 CBM | 15+ CBM |
| Shipment type | Launches or test orders | Recurring, high-volume replenishment |
| Handling preference | More touchpoints are acceptable | Fewer touchpoints and lower handling risk |
LCL is often a good fit when you’re launching a new product or moving a smaller test order and the volume doesn’t justify a full container. FCL usually makes more sense when you’re restocking at volume and want fewer touchpoints and steadier handling.
Conclusion: base your decision on all-in cost, timing, and control
When the numbers are close, go with the option that protects timing and cuts handling.
The freight rate is only the starting point. Landed cost needs to include every dollar from the factory in China to the Amazon fulfillment center – origin charges, ocean freight, customs, duties, drayage, and FBA prep. LCL can look cheaper at first glance, but the extra handling and slower transit often shrink the gap between the quoted rate and the actual landed cost. FCL comes with a higher fixed cost, but once volume is high enough, it can lower per-unit cost and cut the number of times your cargo is handled.
The choice comes down to shipment size, delivery timing, and how much handling risk you can take on. Run the full math on both options before you book.
FCLGO can help with China-to-U.S. FCL or LCL shipping, customs clearance, warehousing, trucking, FBA prep, and delivery to Amazon.
FAQs
How do I find my FCL vs. LCL break-even point?
Compare the total cost of an LCL shipment with the fixed rate of a 20-foot container. With LCL, carriers charge by cubic meter (CBM) or per 1,000 kg, whichever is greater. That means the cost per unit often climbs as your shipment gets bigger.
A common rule of thumb: at around 15 CBM, FCL often starts to make more sense on price and speed.
To find your exact break-even point, get quotes for both options. Then divide each total shipping cost by your number of units to calculate the per-unit landed cost.
What charges are usually missing from an LCL quote?
An LCL quote often leaves out charges that show up at destination after the shipment arrives. Common examples include:
- Destination port fees and terminal handling
- Inland trucking or drayage to the Amazon fulfillment center or warehouse
- Customs-related costs, including ISF or entry processing, customs clearance, and duty payment
It can also leave out added storage or labor charges if customs release or port release gets delayed.
How should I plan for Amazon-ready timing, not just transit time?
Work backward from your target in-stock date, not just the ocean transit window.
That means your timeline should cover the whole trip:
- Production
- Origin handling
- Customs clearance
- Final delivery
- A separate buffer for Amazon appointment scheduling and receiving delays
Here’s the part many sellers miss: freight can arrive at the port and still NOT be available for sale. Amazon check-in delays and appointment backlogs can eat up days fast.
For planning, add these buffers:
- West Coast: 7–14 days
- East Coast: 10–15 days
- LCL to West Coast: 14–21 days
- LCL to East Coast: 20–30 days
During peak season, from August through December, add 10–14 more days on top of that.
发表回复